Expert Guide to the Hoover, AL Real Estate Market 2026 — What Buyers and Sellers Need to Know
Real Estate, Hoover AL real estate market 2026, Birmingham real estate trends 2026
How to Read the Hoover AL Real Estate Market Like an Expert in 2026
Understanding the numbers behind the Hoover AL real estate market 2026 can turn guesswork into confident decisions. Whether you are planning to buy or sell, learning how to interpret a few key stats will help you price, time, and negotiate like a pro.

The 2026 Hoover Snapshot: Key Numbers to Know
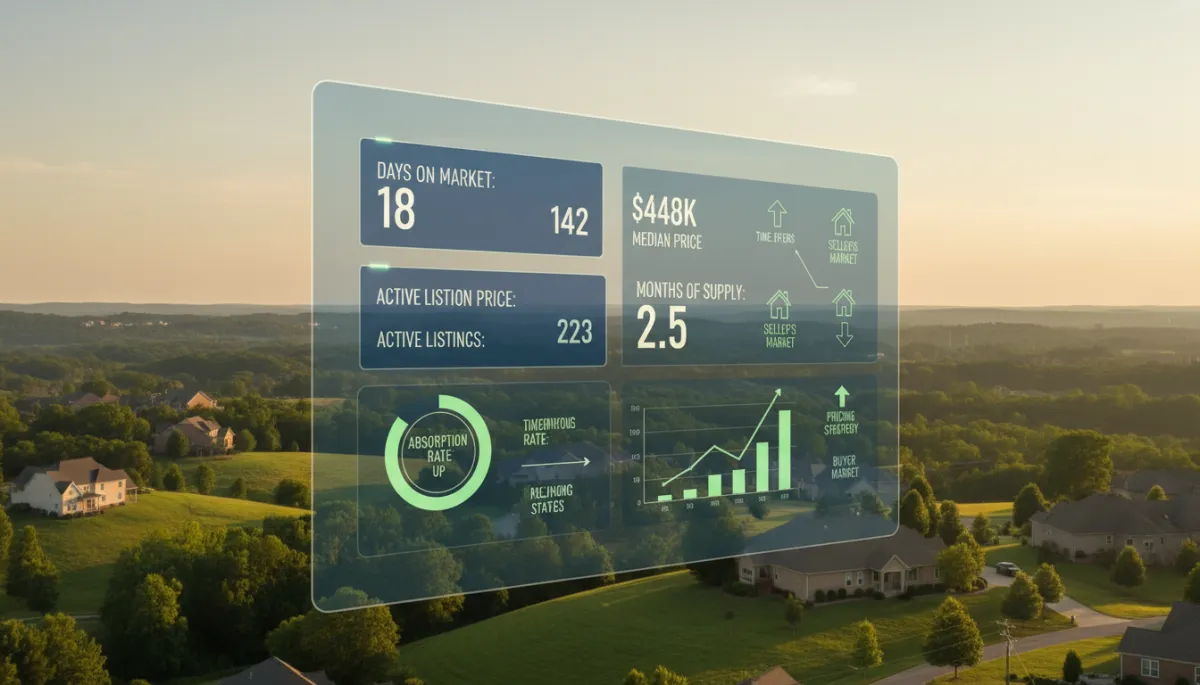
As of mid‑2026, Hoover remains one of the strongest suburban markets in the Birmingham metro. Recent data from sources like Zillow, Redfin, and Realtor.com shows steady price growth, homes selling near asking price, and inventory that still favors sellers. For this guide, we will use a simplified local snapshot so you can easily practice reading the market:
- Median home price: about $448,000
- Active listings: roughly 142 homes on the market
- Average days on market (DOM): around 18 days before going under contract
These numbers line up with broader Birmingham real estate trends 2026: values are up modestly year over year, and well‑priced homes still move quickly. Now, let’s break down the core metrics every Hoover buyer and seller should know.
1. Days on Market (DOM): Speed Signals Demand
Days on market (DOM) measures how long a home takes to go from “active” to “under contract.” In Hoover right now, an average of 18 DOM is very fast. For context, many balanced markets run 30–60 days. National and Alabama data show that when homes sell in under three weeks, demand is clearly strong.
How sellers can use DOM: If similar homes in your neighborhood are going pending in about 18 days and yours has been sitting for 30+, the market is telling you something. Either:
- Your price is too high for current demand, or
- Your presentation (photos, staging, condition) is not competitive.
A practical rule: if you have had 10+ showings and no offers in Hoover’s 2026 market, it is time to adjust your price or your presentation.
How buyers can use DOM: When you see a fresh listing in Hoover with 2–5 days on market, expect strong competition and limited room to negotiate. If a similar home has been sitting for 25–30 days in an 18‑day market, you may have leverage to ask for:
- A lower price
- Closing cost help
- Repairs or upgrades after inspection
2. List‑to‑Sale Price Ratio: How Much Homes Actually Sell For
The list‑to‑sale price ratio compares the final sales price to the original asking price. In Hoover and across the Birmingham metro, recent reports show homes closing at roughly 99% of list price, with a share selling slightly above and many slightly below asking.
How sellers can use this ratio: If similar homes are selling for 99% of list, you should not expect to overprice by 5–10% and still get your number. Instead:
- Price close to fair market value, then aim to achieve 98–100% of that price.
- Use a strategic list price (for example, $449,900 instead of $460,000) to attract more showings and offers.
How buyers can use this ratio: In a market closing at 99% of list, offering 90% on a fresh Hoover listing is unlikely to work. Instead:
- For new, well‑priced homes: aim for 98–100% of asking, especially if there are multiple offers.
- For homes that have sat longer than the 18‑day average: you might reasonably start at 95–97% of list, depending on condition and competition.

Studying Hoover’s DOM and price ratios helps buyers and sellers set realistic expectations.
3. Months of Supply: Measuring Market Balance
Months of supply (also called months of inventory) estimates how long it would take to sell all current listings if no new homes came on the market. Nationally, about 6 months of supply is considered a balanced market. Hoover’s recent MLS and regional reports have shown closer to 2.5–3 months of supply, which leans toward a seller’s market.
Using our simplified snapshot of 142 active listings, if Hoover is closing around 45–55 sales per month, that also works out to roughly 2.5–3 months of supply—consistent with a market that still favors sellers but is not overheated.
How sellers can use months of supply: Low supply means you can be firmer on price and less generous on concessions, as long as you are priced in line with comparable sales. It is still wise to avoid “testing the market” with a wildly high number; buyers in 2026 have plenty of data and will simply move on.
How buyers can use months of supply: In a 2.5–3‑month market, you need to be prepared:
- Have pre‑approval ready before touring Hoover homes.
- Move quickly on homes that clearly fit your needs and budget.
4. Absorption Rate: How Fast Inventory Is Being “Absorbed”
The absorption rate tells you what percentage of available homes sell in a given month. It is another way to describe demand. To calculate it, divide the number of homes sold in a month by the number of homes for sale.
Using our example: if 50 Hoover homes sell in a month and there are 142 active listings, the absorption rate is about 35%. Anything above 20% generally indicates a seller‑leaning market. Hoover’s strong absorption fits with what we see in broader how to read housing market Alabama guides: desirable suburbs around Birmingham are still moving faster than many rural areas.
How sellers can use absorption rate: A high absorption rate means serious buyers are out there. If your home is not attracting them, the issue is usually price, condition, or marketing—not the market itself. Adjust early rather than chasing the market down with multiple price cuts.
How buyers can use absorption rate: In a 30–35% absorption market, waiting “just to see what happens” often means losing the homes you like. Instead, track new listings daily and be ready to view and offer within the first few days on promising properties.
5. Seller’s Market vs. Buyer’s Market: What It Looks Like in Hoover
Putting it all together, here is how market type typically shows up:
- Seller’s market: Low months of supply (under ~4), high absorption rate (20%+), low DOM (under 25 days), and list‑to‑sale ratios near or above 100%.
- Buyer’s market: Higher months of supply (6+), lower absorption rate, longer DOM (60+ days), and list‑to‑sale ratios closer to 95% or below.
Hoover in 2026 clearly leans seller‑friendly: about 18 DOM, roughly 2.5–3 months of supply, and homes closing near asking price. It is not the frenzy of some previous years, but sellers still hold the slight advantage.
6. Using the Data to Time Offers and Pricing Decisions
Knowing the numbers is only helpful if you turn them into action. Here is how to apply these Hoover‑specific signals to your next move.
If You Are Selling in Hoover in 2026
- Price with the data, not your emotions. Look at recent sales within a mile of your home around the $448K median. Aim to be in line with those numbers, not far above them.
- Watch your first 14–21 days closely. In an 18‑day DOM market, that window tells you if you are on target. Few showings or no offers? Adjust quickly.
- Expect near‑list offers if you are priced right. With Hoover’s list‑to‑sale ratio around 99%, clean, move‑in‑ready homes often receive strong offers without huge discounts.
If You Are Buying in Hoover in 2026
- Use listing alerts to act fast. In an 18‑day DOM market, the best homes can be under contract in a week. Set up smart alerts so you see new Hoover listings as soon as they hit the market.
- Match your offer to the property’s story. For a new, well‑priced listing in a hot neighborhood, consider full price or close to it. For a home that has doubled the average DOM, you may have room to negotiate below list or ask for seller concessions.
- Compare Hoover to nearby Birmingham trends. When you understand Birmingham real estate trends 2026 as a whole, you can see where Hoover is outperforming and decide whether to stretch your budget for a stronger‑performing suburb.
Turn Hoover Market Data into Confident 2026 Decisions
Learning how to read housing market Alabama statistics—DOM, list‑to‑sale ratio, months of supply, and absorption rate—gives you a practical framework for every choice you make. In Hoover’s 2026 market, the numbers point to steady demand, limited but not extreme inventory, and prices that reward realistic, data‑driven strategies.
Sellers who price based on the data and respond quickly to feedback will capture top dollar. Buyers who prepare, watch the numbers, and act decisively will still find excellent opportunities in one of the Birmingham area’s most desirable communities.


